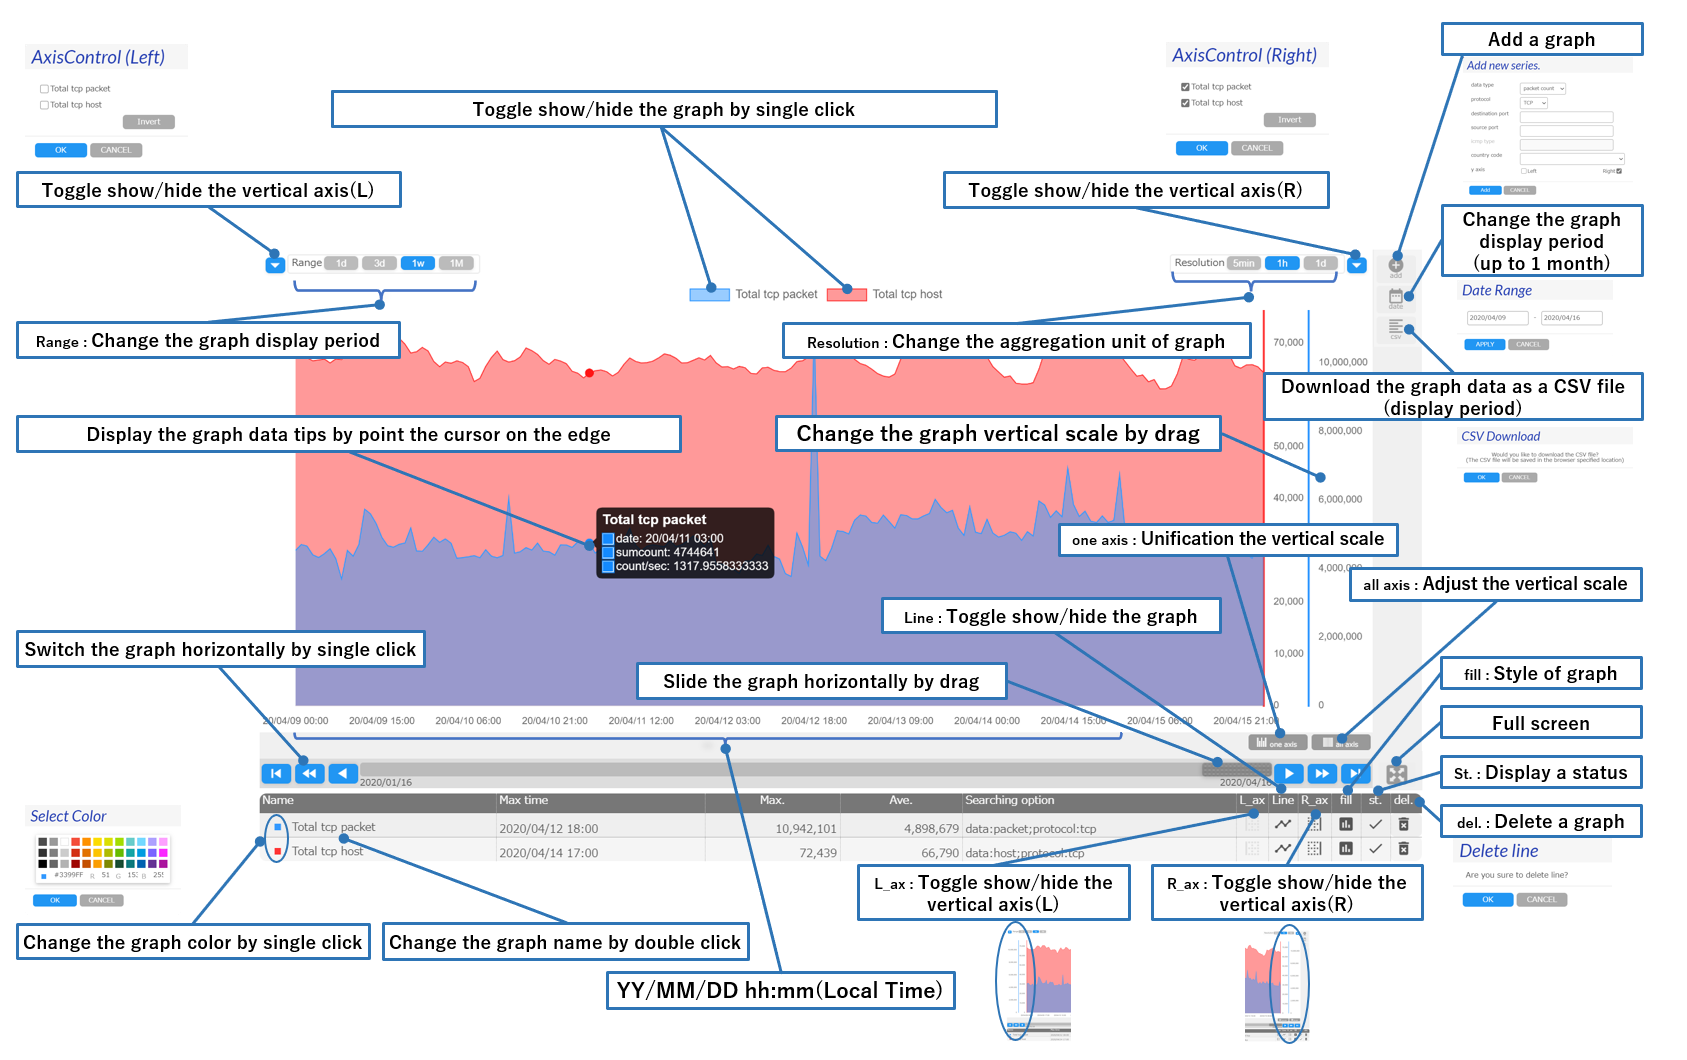
Stats visualizes time series data of darknet traffic (hosts and packets) in a specified unit time (5 minutes, 1 hour, and 1 day). The vertical axis of the graph is either the number of packets or the number of hosts of the specified protocol (TCP, UDP, and ICMP). The default display shows the total tcp packets and total unique hosts for the past one week. By operating vertical slider bar at the bottom, you can change the start time of the period (you may go back to 3 months maximum).

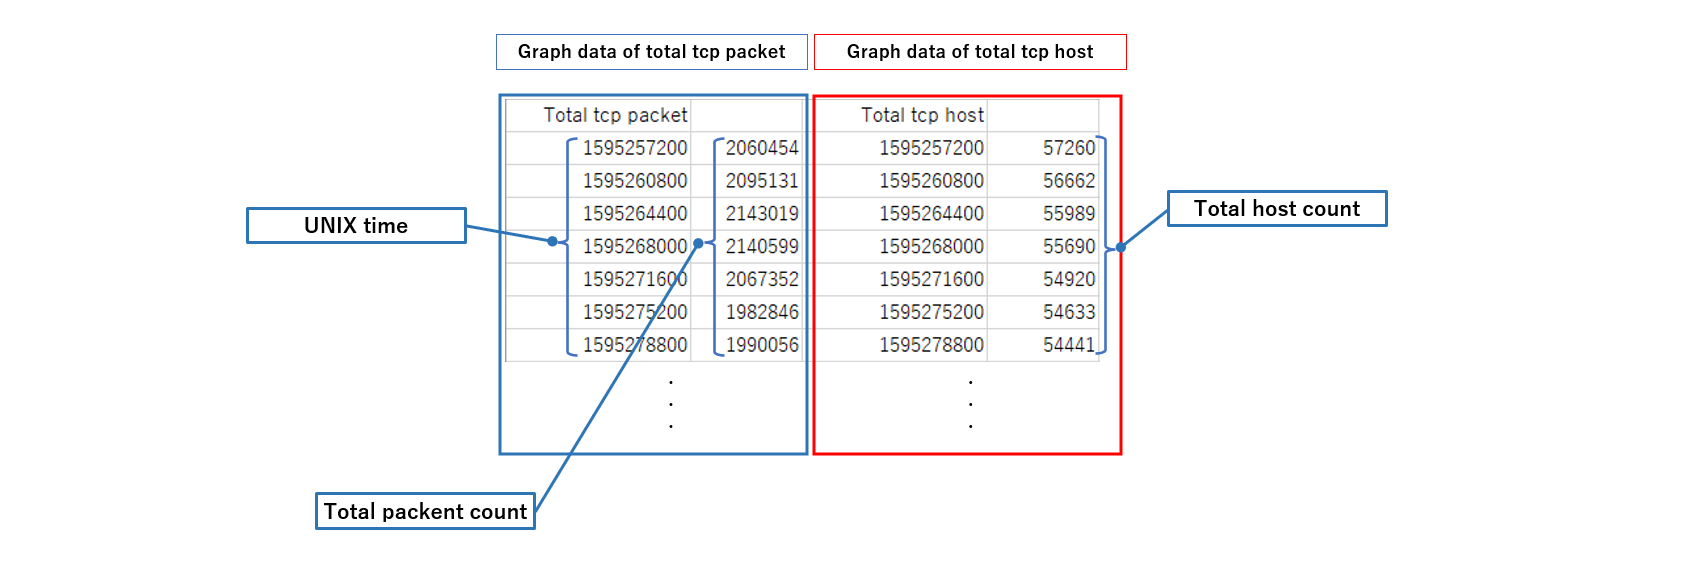
CSV Format example
